
“10 minutes to pandas” 문서를 따라해보며 작성했습니다.
https://pandas.pydata.org/pandas-docs/stable/user_guide/10min.html
2022. 02. 02 최초작성
2022. 03. 20
DataFrame이나 Series에 저장된 데이터에 대해 특정 연산을 수행하는 예제들입니다.
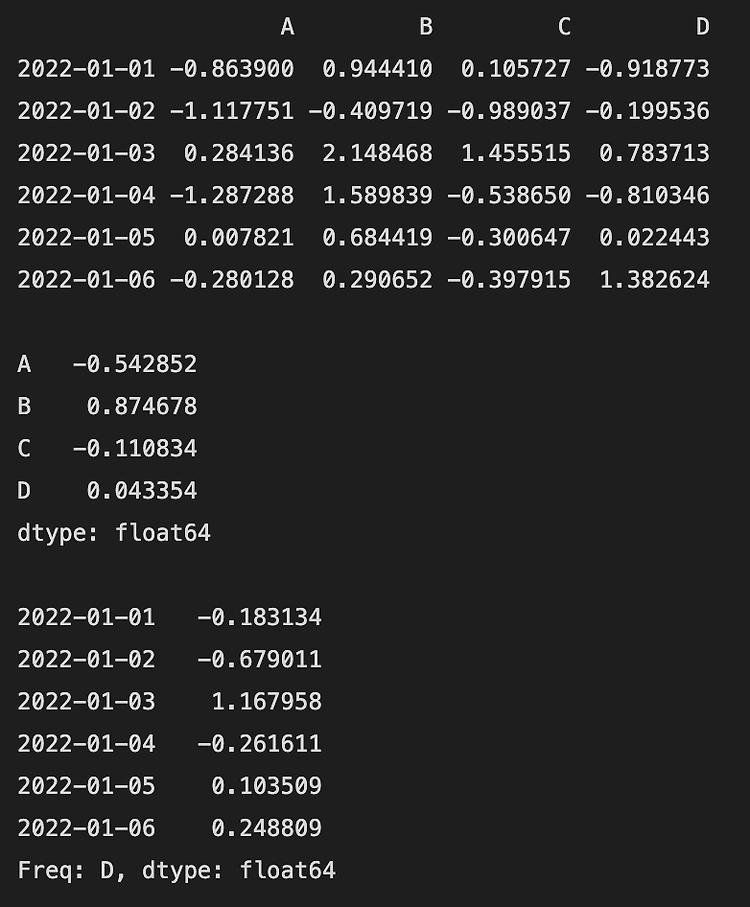
행 또는 열을 기준으로 평균을 구합니다.
| import numpy as np import pandas as pd dates = pd.date_range("20220101", periods=6) df = pd.DataFrame(np.random.randn(6, 4), index=dates, columns=list("ABCD")) print(df) print() # 열을 기준으로 평균을 구합니다. print(df.mean()) print() # 행을 기준으로 평균을 구합니다. print(df.mean(1)) |

shape와 인덱스와 열 이름이 똑같은 Dataframe간에는 문제없이 빼기 연산이 됩니다.
| import numpy as np import pandas as pd dates = pd.date_range("20220101", periods=4) # 열 이름과 인덱스가 동일한 두 개의 DataFrame 객체를 생성합니다. s1 = pd.DataFrame(np.arange(12).reshape(4,3), index=dates, columns=list("ABC")) print(s1.shape) print(s1) print() s2 = pd.DataFrame(np.arange(12).reshape(4,3), index=dates, columns=list("ABC")) print(s2.shape) print(s2) print() # s2에서 s1을 빼는 연산을 수행합니다. ret = s2.sub(s1) print(ret.shape) print(ret) |

컬럼 이름이 다르거나 인덱스가 다른 경우에는 원하는 결과를 얻을 수 없습니다.
대응하는 열 이름이나 대응하는 인덱스가 없는 경우 계산할 수 없기 때문에 NaN으로 표시됩니다.
일치하는 열이름이 없는 경우 예제입니다.
| import numpy as np import pandas as pd dates = pd.date_range("20220101", periods=4) s1 = pd.DataFrame(np.arange(12).reshape(4,3), index=dates, columns=list("DEF")) print(s1.shape) print(s1) print() s2 = pd.DataFrame(np.arange(12).reshape(4,3), index=dates, columns=list("ABC")) print(s2.shape) print(s2) print() # s1과 s2사이에는 일치하는 열이름이 없기 때문에 모두 NaN이 됩니다. ret = s2.sub(s1) print(ret.shape) print(ret) |

일치하는 인덱스가 없는 경우 예제입니다.
| import numpy as np import pandas as pd dates = pd.date_range("20220101", periods=4) s1 = pd.DataFrame(np.arange(12).reshape(4,3), index=dates, columns=list("ABC")) print(s1.shape) print(s1) print() dates = pd.date_range("20220201", periods=4) s2 = pd.DataFrame(np.arange(12).reshape(4,3), index=dates, columns=list("ABC")) print(s2.shape) print(s2) print() # s2와 s1사이에는 일치하는 인덱스가 없기 때문에 모두 NaN이 됩니다. ret = s2.sub(s1) print(ret.shape) print(ret) |

shape가 다른 경우에는 인덱스와 열 이름이 동일한 셀들만 계산결과가 출력됩니다.
| import numpy as np import pandas as pd dates = pd.to_datetime(["20220101", "20220113", "20220112", "20220111"]) s1 = pd.DataFrame(np.array([5, 10, 15, 25]), index=dates, columns=list("A")) print(s1.shape) print(s1) print() dates = pd.date_range("20220101", periods=4) s2 = pd.DataFrame(np.arange(12).reshape(4,3), index=dates, columns=list("ABC")) print(s2.shape) print(s2) print() # 열이름이 A이고 인덱스가 2022-01-01인 셀만 s1과 s2에 있으므로 계산 결과가 NaN이 아닙니다. ret = s2.sub(s1) print(ret.shape) print(ret) |

DataFrame에서 넘파이 배열을 빼는 경우에는 shape가 다르더라도 크기를 맞추는 브로드캐스트에 의해서 계산이 이루어집니다.
shape가 (4, 3)인 DataFrame에서 shape가 (3, )인 넘파이 배열을 빼는 예제입니다.
모든 행에서 넘파이 배열의 값을 뺀 결과를 얻습니다.
| import numpy as np import pandas as pd dates = pd.date_range("20220101", periods=4) s1 = pd.DataFrame(np.arange(12).reshape(4,3), index=dates, columns=list("ABC")) print(s1.shape) print(s1) print() np_array = np.array([1, 1, 1]) print(np_array.shape) print(np_array) print() ret = s1.sub(np_array) print(ret.shape) print(ret) |

행 또는 열별로 통계치를 구하는 예제입니다.
| import numpy as np import pandas as pd dates = pd.date_range("20220101", periods=4) s1 = pd.DataFrame(np.arange(12).reshape(4,3), index=dates, columns=list("ABC")) print(s1.shape) print(s1) print() # 열 별로 최대값을 출력합니다. print(s1.apply(np.max, axis=0)) print() # 행 별로 최소값을 출력합니다. print(s1.apply(np.min, axis=1)) print() # 열별로 최대값과 최소값의 차이를 구합니다. print(s1.apply(lambda x: x.max() - x.min())) |

DataFrame에 특정 숫자가 몇개있는지를 출력하는 히스토그램을 계산합니다.
| import numpy as np import pandas as pd # 4 ~ 6사이의 숫자를 12개 무작위로 생성합니다. s1 = pd.DataFrame(np.random.randint(4, 7, size=12)) print(s1.shape) print(s1) print() # 4 ~ 6별로 각각 몇개가 있는지 개수를 카운트합니다. print(s1.value_counts()) |

문자열을 다룰 수 있는 메소드들이 제공됩니다.
https://pandas.pydata.org/pandas-docs/stable/user_guide/text.html#text-string-methods
아래 예제는 Series에 저장된 문자열에 포함된 대문자를 소문자로 바꿉니다.
| import numpy as np import pandas as pd s = pd.Series(["A", "B", "C", "Aaba", "Baca", np.nan, "CABA", "dog", "cat"]) # 소문자로 변환합니다. print(s.str.lower()) |

Pandas 강좌 1 - Pandas 객체 생성
https://webnautes.tistory.com/1957
Pandas 강좌 2 - 데이터 보는 방법
https://webnautes.tistory.com/1958
Pandas 강좌 3 - 데이터 선택하는 방법
https://webnautes.tistory.com/1959
Pandas 강좌 4 - 연산(Operations)
https://webnautes.tistory.com/1960
Pandas 강좌 5 - 연결 및 그룹핑
https://webnautes.tistory.com/1961
Pandas 강좌 6 - 시계열(Time series)
https://webnautes.tistory.com/1962
Pandas 강좌 7 - 그래프 그리기(Plotting)
https://webnautes.tistory.com/1963
Pandas 강좌 8 - Pandas에서 CSV, HDF5, Excel로 저장 및 읽기
https://webnautes.tistory.com/1964
Pandas 강좌 9 - 결측치(Missing data)
https://webnautes.tistory.com/1965
'Python > Pandas' 카테고리의 다른 글
| Pandas 강좌 6 - 시계열(Time series) (0) | 2023.10.12 |
|---|---|
| Pandas 강좌 5 - 연결 및 그룹핑 (0) | 2023.10.12 |
| Pandas 강좌 2 - 데이터 보는 방법 (0) | 2023.10.12 |
| Pandas 강좌 1 - Pandas 객체 생성 (0) | 2023.10.12 |
| pandas의 read_csv 함수에 사용되는 경로 문자열 앞에 r을 붙이는 이유 (0) | 2023.10.09 |


