
“10 minutes to pandas” 문서를 따라해보며 작성했습니다.
https://pandas.pydata.org/pandas-docs/stable/user_guide/10min.html
2022. 02. 02 최초작성
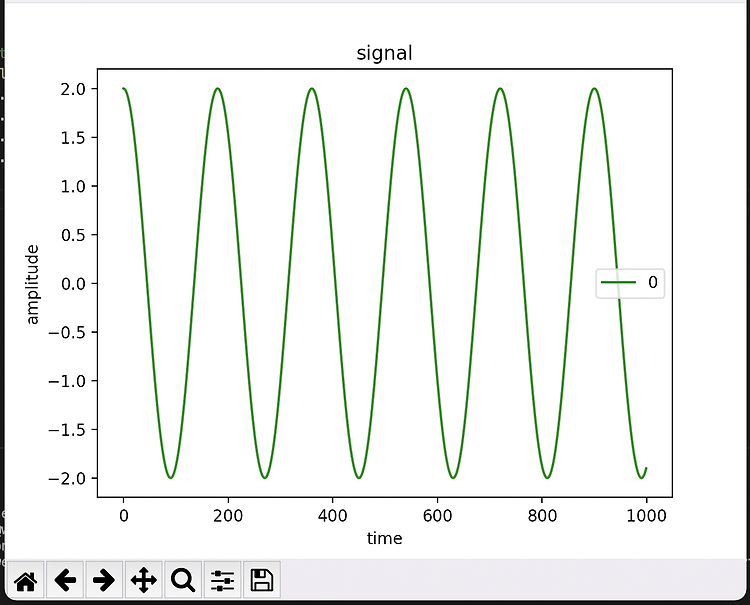
matplotlib와 함께 사용하여 그래프를 그릴 수 있습니다.
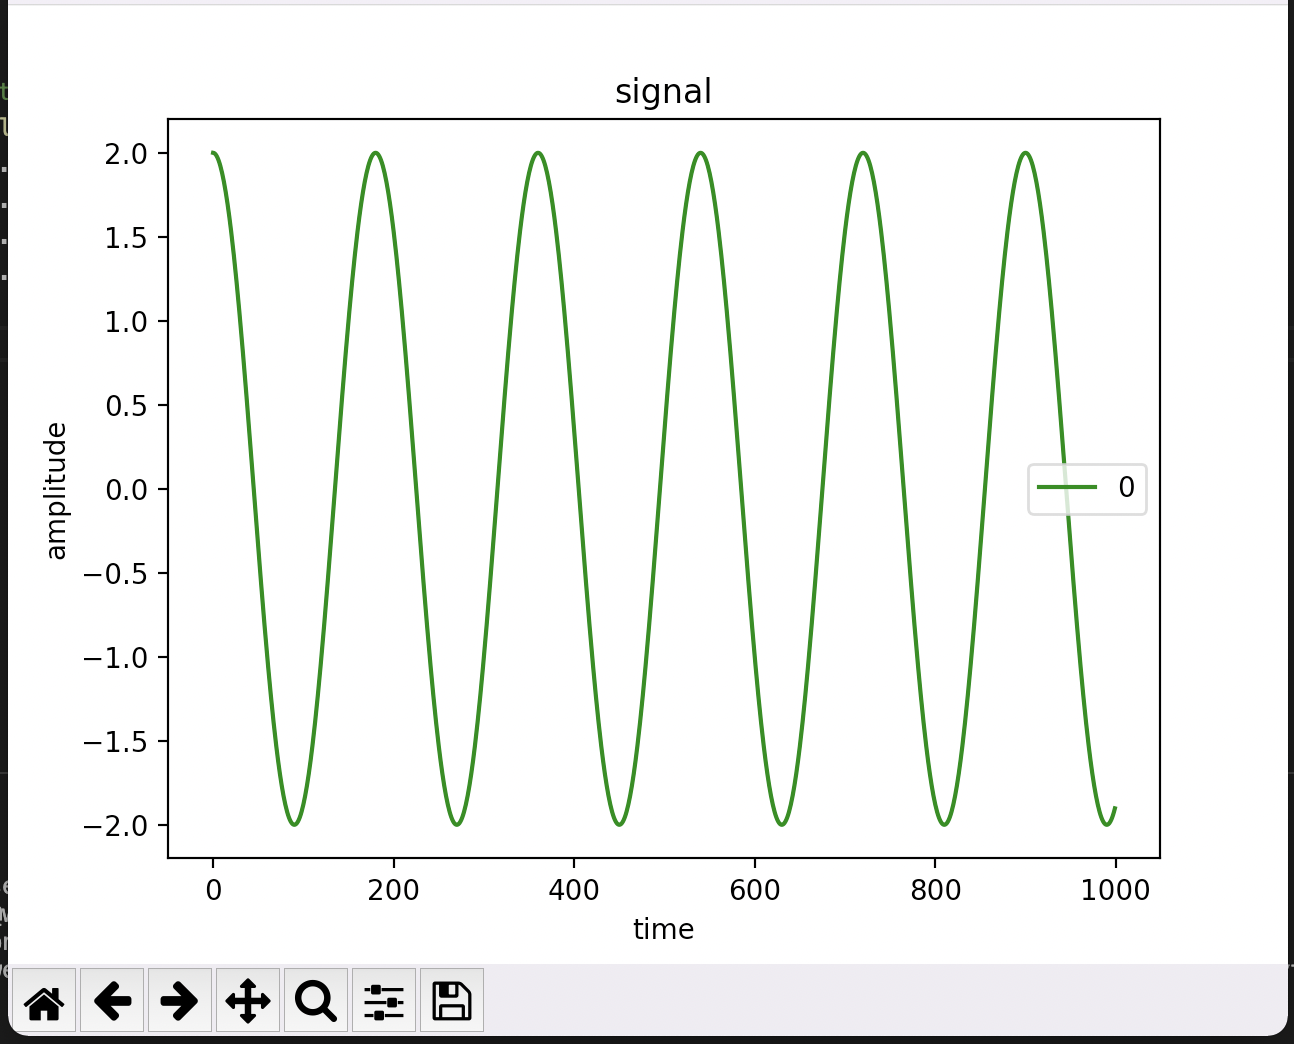
| import numpy as np import pandas as pd import matplotlib.pyplot as plt t = np.arange(0, 1000) y = pd.DataFrame(2*np.cos(2*np.pi/180*t), index=t) # 다음 두 가지 방식으로 그래프를 그릴 수 있습니다. #plt.plot(y, c='green') y.plot(c='green') plt.title('signal') plt.xlabel('time') plt.ylabel('amplitude') plt.show() |
Pandas 강좌 1 - Pandas 객체 생성
https://webnautes.tistory.com/1957
Pandas 강좌 2 - 데이터 보는 방법
https://webnautes.tistory.com/1958
Pandas 강좌 3 - 데이터 선택하는 방법
https://webnautes.tistory.com/1959
Pandas 강좌 4 - 연산(Operations)
https://webnautes.tistory.com/1960
Pandas 강좌 5 - 연결 및 그룹핑
https://webnautes.tistory.com/1961
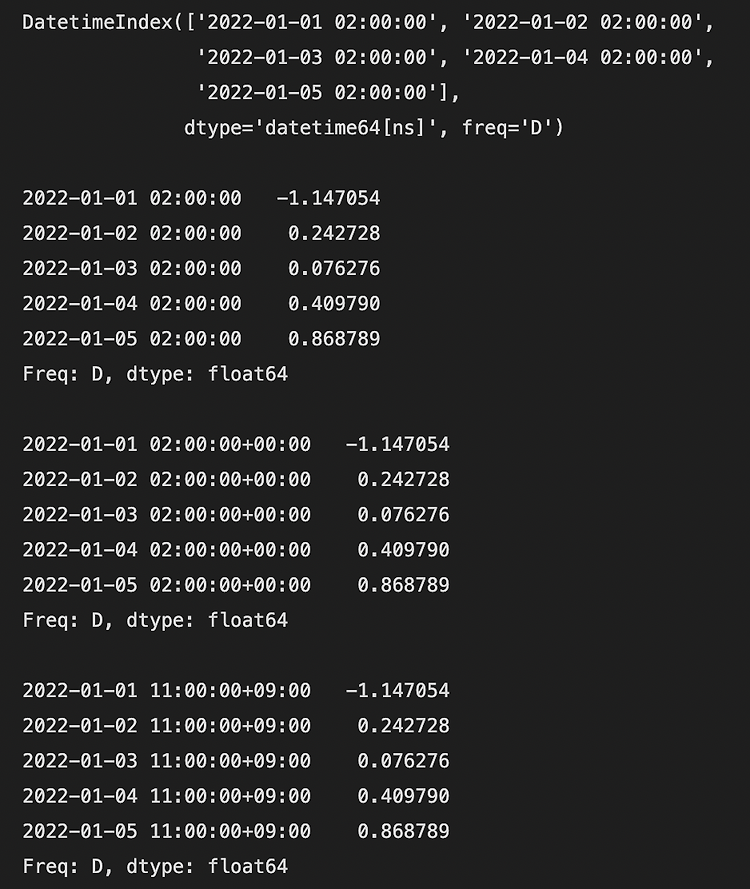
Pandas 강좌 6 - 시계열(Time series)
https://webnautes.tistory.com/1962
Pandas 강좌 7 - 그래프 그리기(Plotting)
https://webnautes.tistory.com/1963
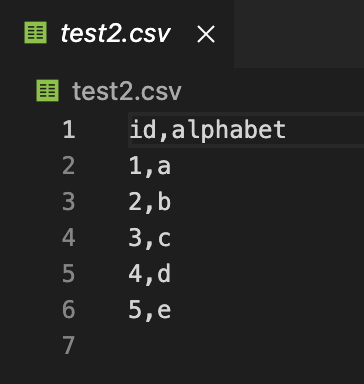
Pandas 강좌 8 - Pandas에서 CSV, HDF5, Excel로 저장 및 읽기
https://webnautes.tistory.com/1964
Pandas 강좌 9 - 결측치(Missing data)
https://webnautes.tistory.com/1965
'Python > Pandas' 카테고리의 다른 글
| Pandas 강좌 9 - 결측치(Missing data) (0) | 2023.10.12 |
|---|---|
| Pandas 강좌 8 - Pandas에서 CSV, HDF5, Excel로 저장 및 읽기 (0) | 2023.10.12 |
| Pandas 강좌 6 - 시계열(Time series) (0) | 2023.10.12 |
| Pandas 강좌 5 - 연결 및 그룹핑 (0) | 2023.10.12 |
| Pandas 강좌 4 - 연산(Operations) (0) | 2023.10.12 |
시간날때마다 틈틈이 이것저것 해보며 블로그에 글을 남깁니다.
블로그의 문서는 종종 최신 버전으로 업데이트됩니다.
여유 시간이 날때 진행하는 거라 언제 진행될지는 알 수 없습니다.
영화,책, 생각등을 올리는 블로그도 운영하고 있습니다.
https://freewriting2024.tistory.com
제가 쓴 책도 한번 검토해보세요 ^^